One of the key science measurands is temperature (Boer, 1965), which in science is often combined with the long-term recording and second measurand like the expansion of gas or liquid in order to come to any kind of scientific conclusion. For meaningful outcomes, the recordings made only sense when the temperature scale was set by Fahrenheit and later Celsius as adapted and in use still today.
Possibly the oldest way for recording is a pen and paper write down of the temperature at specific time intervals, however, such a recording was left out in the medical studies of Becquerel and Breschet in 1835, which would have allowed for underpinning their work and sharing with colleagues (Woodhead & Varrier-Jones, 1916). Manual data recordings were done by Wunderlich and could be further developed by Aitkens, allowing publishing in medical journals. A development of better thermometers, the build-up of knowledge and conclusions led E. Long Fox in 1870 to the statement that with the use of the thermometer, it will save time for the practitioner, allowing him to judge from the existing data and information to come to a proper diagnosis quicker.
In the mid-20th Century one approach of automatic data capturing was a device developed by E. Dahl in 1949, see Figure 1.1:
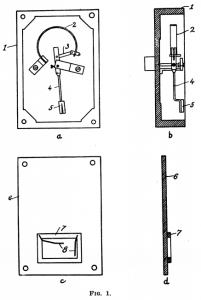
Figure 1.1: Device for automatic temperature recording. Source: Adapted from Science 1948 Vol 110, p.506, E. Dahl
The device combined a bimetal stripe and a photometric plate, which allowed, after some interpolation of the raw data, to generate a graph of one year of temperature development (Dahl, 1949), see figure 1.2.
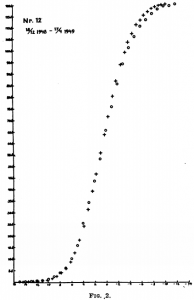
Figure 1.2: Graph of temperature recording from E. Dahl;
Source: Adapted from Science 1948 Vol 110, p.507, E. Dahl
In 1968 it was still common to use live data from the environment and to print it on paper as Dr. Weichart did, and do not record the given data in any kind of IT system. While some published the graphs created, Weichart’s report was only presenting the min. and max. numbers of his graph (Weichart, 1970), allowing for no further data analysis like overall and average variance in the measurements.
Today’s temperature recording would typically be done via an Internet of Things (IoT) device which is directly connected (even wirelessly) to a server (which could be cloud based) and allow real time data capture, analysis and permit for warnings, in case a threshold was breached. As part of a Machine-to-machine (M2M) communication of such an IOT device, it could automatically receive an appropriated action back from the server, e.g. machine shutdown due to a too high temperature as outlined in the “Wireless bi-directional data link for smart temperature recording” from (Wu, Liu, Zhang, & Zhou, 2016).
Such a permanent recording of temperature, combined with an accurate database, could allow for a prediction of an upcoming failure of maintenance need as demonstrated in “Several aspects of the temperature history in relation to the cyclic behaviour of an austenitic stainless steel” by (Gentet, Feaugas, Risbet, Lejeail, & Pilvin, 2011).
In a science project by (Redfern, et al., 2017) rats were tracked with HD cameras and RFID, while an array of infrared thermometers was logging the temperature, an IT based system combined the data of the three capture devices (Camera, RFID, IR Thermometer) and allowed for recording of the temperature of the individual animal. This experiment proofed the concept to allow temperature recording in the common group-environment (rather than isolation), allowing for more realistic outcomes of any tests in pharmacology, toxicology and disease models when using such an environment. The captured data is very precise and can be re-used for further analysis across experiments.
All epistemological ways should be considered when building such a system, to avoid issues highlighted by Besson (2010).
References
Besson, U. (2010). The History of the Cooling Law: When the Search for Simplicity can be an Obstacle. Springer Science+Business Media B.V. 2010, 1085–1110. doi:DOI 10.1007/s11191-010-9324-1
Boer, J. d. (1965). Temperature as a Basic Physical Quantity. Metrologia, 158.
Dahl, E. (1949). A New Apparatus for Recording of Ecologic and Climatic Factors, especially Temperature. Science, 506-507. Retrieved from http://science.sciencemag.org.salford.idm.oclc.org/content/sci/110/2863/506.full.pdf
Gentet, D., Feaugas, X., Risbet, M., Lejeail, Y., & Pilvin. (2011). Several aspects of the temperature history in relation to the cyclic behaviour of an austenitic stainless steel. Materials Science and Engineering A 528, 7696– 7707.
Redfern, Tse, Grant, Keerie, Simpson, Pedersen, . . . Armstrong. (2017). Automated recording of home cage activity and temperature of individual rats housed in social groups: The Rodent Big Brother project. PLoS ONE 12(9). doi:https://doi.org/10.1371/journal.pone.0181068
Weichart, G. (1970). Kontinuierliche Registrierung der Temperatur und der Phosphat-Konzentration im Oberfl~ichenwasser des nordwestafrikanischen Auftriebswasser-Gebietes. Deutsche Hydrografische Zeitschrift, 49-60.
Woodhead, G. S., & Varrier-Jones, P. C. (1916). Clinical Thermometry: Continous and quasi-continous Temperature records in man and animals in health and disease. The Lancet, 173-180. doi:https://doi.org/10.1016/S0140-6736(00)53012-8
Wu, N., Liu, C., Zhang, B., & Zhou, S. (2016). Wireless bi-directional data link for smart temperature recording. Transactions of the Institute of Measurement and Control Vol 39, I 4, 420-428. doi:https://doi.org/10.1177/0142331216675402