
As with astroinformatics, the field of bioinformatics has been formed and established to have a continuous epistemology in the field dealing with computer science, mathematics and biology (IEEE , 2005).
The field bioinformatics was probably introduced during the high times of the DNA sequencing, where a lot of data was generated and need to be processed, stored and archived. The next step for biologists was to create and measure multiple gene expressions from the received data, and in turn, creating even more data. The base approach was always to expose a probe with DNA with thousands of DNA nucleotides and trying to find (partially) matches between the two, which allowed the scientists to relate them to each other (Polanski & Kimmel, 2007). This was further enhanced via the proteomic techniques, allowing a combination of several steps into one
For IS this did mean new developments in computational algorithms and a creation of self-organizing maps from the newly created data. The newly created databases did not only require to be approached differently, they also allow for an empiric conclusion and higher qualitative research. For research, mathematical statics and probabilities are calculated to provide an indication of a conclusion or a requirement for more experiments (Polanski & Kimmel, 2007). Most of these requests are done in a high-level programming language like Matlab, Maple or Mathematica as they can support the scientific requirements more dynamically.
The existing data can be access via Internet, for example, the clinical database were clinical cases and possible treatment plans are stored, naming the EURODIAB as one. Others like 3DNA have the molecules visualized for better understanding, see figure 1 or figure2:
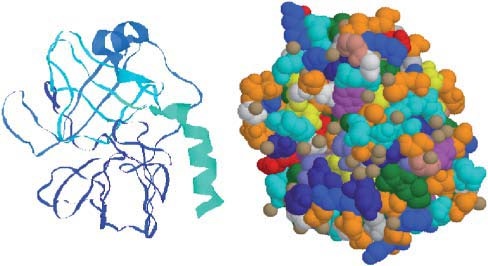
Figure1: Graphical presentation of the enzyme trypsin obtained with the use of spatial coordinates of atoms from Protein Data Bank (accession symbol 2ptn), and the molecular-graphics program Ras Mol. Left: A view resulting from choosing the Ras Mol option “ribbons” for enhancing secondary structures. Right: A view resulting from using “spacefill” option. Different colours represent different amino acids. The meaning of colours is as follows (see also Table 9.1): ASP, GLU, bright red; LYS, ARG, blue; PHE, TYR, mid blue; ALA, dark grey; HIS, pale blue; CYS, MET; yellow; SER, THR, orange; ASN, GLN, cyan; LEU, VAL, ILE, green; TRP, pink; PRO, flesh;
Source: Adapted from: Polanski, A., & Kimmel, M. (2007). Bioinformatics. Warsaw: Springer, p362, figure12.2
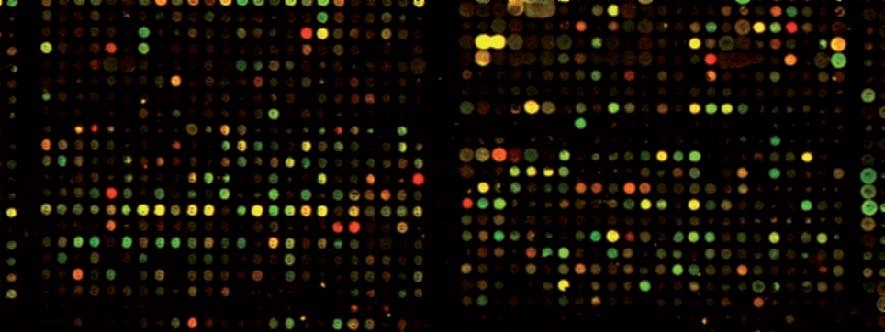
Figure2: An example of an image of a cDNA microarray
Source: Adapted from: Polanski, A., & Kimmel, M. (2007). Bioinformatics. Warsaw: Springer, p363, figure12.3
With ever bigger data streams, the data processing, especially for searches and linkage, is very demanding for computing equipment. To get timely feedback, new means are required, like presented 2017 by Gomez-Vela et al: High performance computing using GPU processing power (instead of only CPU) and distributing the search queries and resulting computing requirements in a grid of several computers which are connected via a Peer-to-Peer (P2P) technology (Gomez-Vela, Lopez, Lagares, & Baena, 2017), allowing data exchange without a central server.
References
Gomez-Vela, F., Lopez, A., Lagares, J., & Baena, D. (2017). Bioinformatics from a Big Data Perspective: Meeting the Challenge. Bioinformatics and Biomedical Engineering – 5th International Work-Conference, IWBBIO 2017 (pp. 349-359). Granada, Spain: Springer.
IEEE . (2005). Chairs Forward. Fifth IEEE Symposium on Bioinformatics and Bioengineering (p. 1). Minneapolis, MN, USA,: ix-ix. doi:10.1109/BIBE.2005.15
Polanski, A., & Kimmel, M. (2007). Bioinformatics. Warsaw: Springer.